The Dividend Discount Model (DDM): The Black Sheep of Valuation?

When I started offering financial modeling training, I never expected to get questions about a methodology like the Dividend Discount Model (DDM).
It’s not a likely interview topic, and it goes against my normal advice to focus on the core concepts, learn them very well, and skip the bells and whistles.
But people who aim for investment banking roles are very much into those bells and whistles, so questions about the DDM and other “exotic” methodologies began rolling in.
To be fair, in some industries – like commercial banks and insurance within FIG – the DDM is a core valuation methodology.
But outside of those, its status is murkier.
It can be useful for certain companies, such as power and utility firms and midstream (pipeline) operators in oil & gas…
…but it’s also much harder to set up and use than a standard DCF.
This tutorial will explain the advantages and disadvantages of the DDM, give you a sample Excel file for a midstream company, and walk you through the steps:
The Dividend Discount Model Template, Files, and Tutorial
For some context, here’s a sample DDM for an oil & gas pipeline company (DT Midstream), the investor presentation, 10-K, and a full video tutorial:
- DT Midstream – Dividend Discount Model (XL)
- DT Midstream – Slide Explanation and Overview (PDF)
- DT Midstream – 10-K with Highlights for Capacity Estimates (PDF)
- DT Midstream – Investor Presentation with CapEx, Dividends, and Other Guidance (PDF)
Table of Contents:
- 1:16: The Short Answer
- 7:07: Part 1: Revenue, Expense, and Cash Flow for DT Midstream
- 10:42: Part 2: Distributable Cash Flow Calculations
- 13:10: Part 3: Debt, Cash, and Interest Projections
- 15:11: Part 4: PV of Dividends, Terminal Value, and Implied Value
- 17:18: Part 5: Merits and Drawbacks of the DDM
- 19:24: Recap and Summary
If you’d rather watch or listen than read, check out the 20-minute video above.
Otherwise, the written version follows:
Why Use a Dividend Discount Model?
The main argument in favor of the DDM is that it best represents what happens in real life when you buy a stock.
In other words, you profit based on the company’s dividends and the potential increases in its stock price over time.
If you think about a standard DCF, metrics like Unlevered Free Cash Flow and Levered Free Cash Flow are a bit “imaginary” – because no company distributes them to its investors.
The DDM is more grounded because it’s based on the company’s actual distributions and potential future value.
And it values the company today based on the present value of its dividends and that potential future value (either the stock price or the Equity Value via the Terminal Value calculation).
If you sum up these numbers, you can see whether the company is valued appropriately.
The Dividend Discount Model works well in two main cases:
- Companies with Special Legal/Regulatory Requirements – For example, banks must maintain a certain amount of regulatory capital (mostly Common Shareholders’ Equity), so they issue dividends based on their capital targets, and you “back into” the proper dividend numbers in models. And Equity Real Estate Investment Trusts (REITs) must distribute almost all their Net Income, so the DDM can work well in REIT valuations.
- Companies That Issue Reliable/Predictable Dividends as a Business Policy – Many oil & gas transportation companies are like this, as are power/utility companies with regional monopolies on essential services like electricity and water.
The DDM is a horrible idea for tech/biotech startups and anything else in the “growth” category with unstable or unpredictable cash flows.
Even if you pick the right company, though, the DDM is more difficult to set up and use than a standard DCF because it requires more assumptions and knowledge of the company’s capital structure.
The Basic Steps of a Dividend Discount Model
Bank and insurance Dividend Discount Models are more complicated (you can see a sample here) and require more industry knowledge, so we’ll focus on normal, non-financial companies.
The basic set of steps looks like this:
Step 1: Forecast Revenue and Expenses
This is the same as in any other 3-statement model or DCF.
You usually link Revenue to market share * market size or units sold * average selling price, with expenses linked to Capacity, unit sales, or another top-level driver.
Step 2: Calculate the “Distributable Cash Flow”
“Distributable Cash Flow” means different things in different industries, but it’s often like Free Cash Flow but with only maintenance CapEx deducted.
In other words, how much cash does the company generate if you ignore the spending required for long-term growth?
You calculate this by starting with Net Income, adding back non-cash expenses, and subtracting only what the company must spend to keep its business running.
Of this remaining cash flow, you assume that some is distributed (Dividends), some is used to grow the business (Growth CapEx), and some is retained (Cash).
Step 3: Project the Changing Cash and Debt Balances and the Net Interest Expense
If the company needs extra funds to maintain its Cash balance, you can assume it issues Debt; if it has excess Distributable Cash Flow, you can assume it retains the Cash.
Interest Income and Interest Expense are based on the changing interest rates times these balances.
Step 4: Discount the Dividends and Terminal Value to Present Value and Add Them
This is like the final step of a DCF, but you use the Cost of Equity since the Dividend Discount Model is based on Equity Value, not Enterprise Value.
Also, the Terminal Value is normally based on a P / E multiple or a Net Income Growth Rate.
The Dividend Discount Model in More Detail
The steps and sample files above are enough to get you started, but here’s a bit more on each step for the company used here (DT Midstream):
Dividend Discount Model, Part 1: Revenue and Expense Forecasts
For oil & gas pipeline companies like this one, Revenue is based on “Capacity” or “Throughput” times the per-unit fees.
In other words, if the company can transport X Billion Cubic Feet (Bcf) of natural gas or Y Barrels of Oil, how much does it charge its clients for each Cubic Foot or Barrel transported?
We backed into these numbers and created trends based on the historical patterns here:

On the expense side, items like operations and maintenance are all tied to Capacity, and they generally increase over time:

Finally, CapEx must be split into Growth and Maintenance for this type of company.
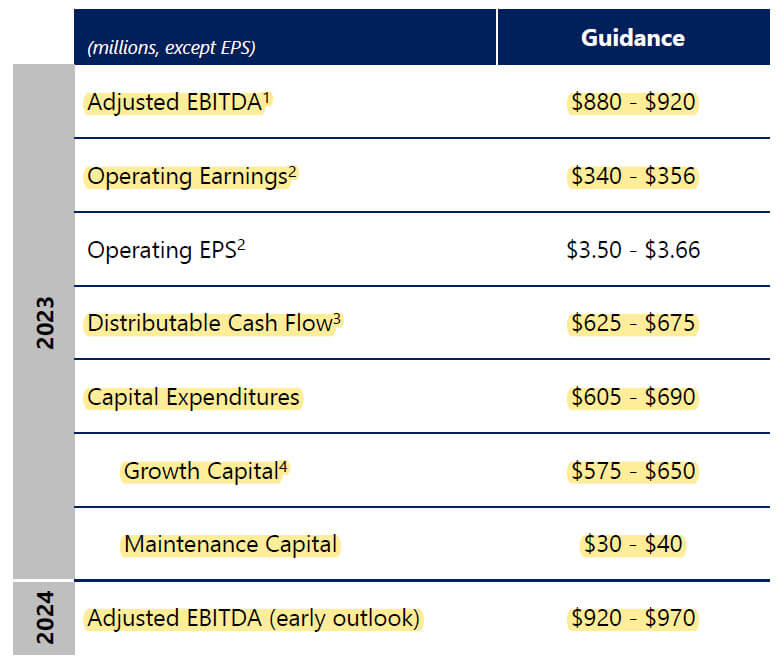
Luckily, they give us estimates for both in the investor presentation, and we can go back and get the historical numbers from the older filings:

After the near-term forecasts through 2027, we make Growth CapEx a percentage of Distributable Cash Flow instead (see below):

There is a question about the relationship between Growth CapEx and Capacity Growth because the historical numbers are all over the place.
I used a more conservative number, but you could argue it’s too low based on the historical data.
Dividend Discount Model, Part 2: Distributable Cash Flow
Distributable Cash Flow is similar to Free Cash Flow (i.e., Cash Flow from Operations minus CapEx) with one major difference: it deducts only Maintenance CapEx.
Unlike Unlevered Free Cash Flow, it also deducts the Net Interest Expense, factors in Equity Investment Dividends, and includes other items related to the capital structure.
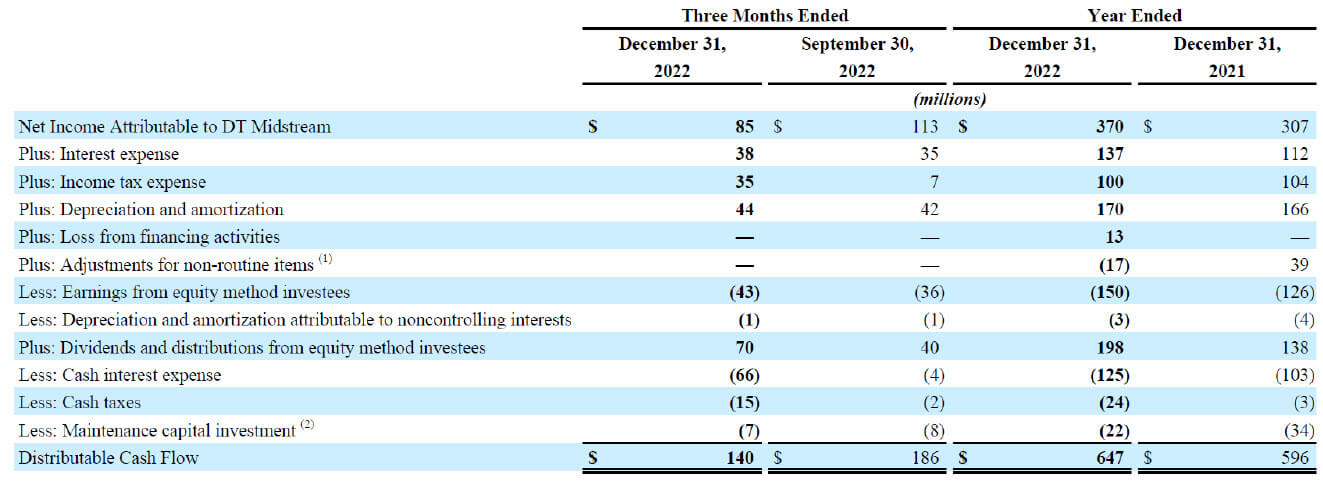
The exact items vary from company to company, but DT Midstream discloses the full calculation in its presentations:

We made simple forecasts for most of these items and assumed that Net Income and Distributable Cash Flow increase over time.
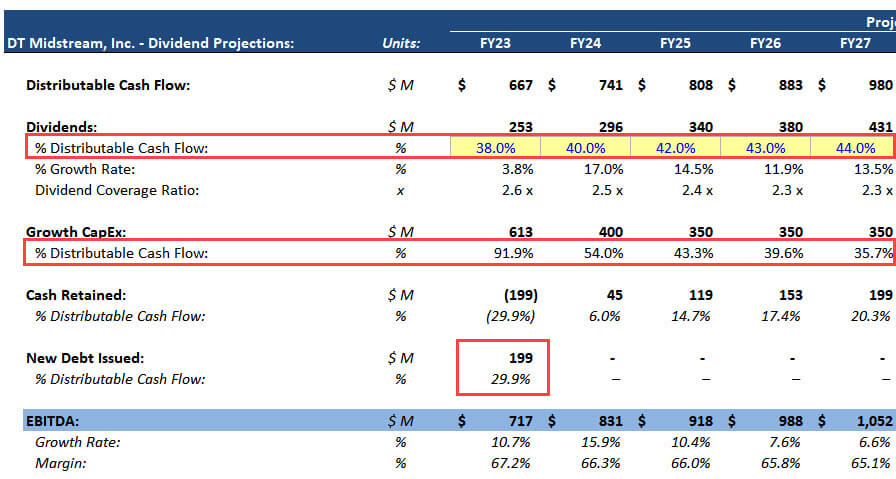
We split it into Dividends, Growth CapEx, and Cash Retained and linked these to the other parts of the model.
If these add up to more than the company’s Distributable Cash Flow, it issues additional Debt to cover the difference:

This setup seems simple, but it’s probably the #1 most common mistake in the DDM.
People tend to ignore this trade-off between Payouts, Growth, and Cash Retention and blindly assume Dividends based on dividend-per-share or EPS figures.
This is wrong because all financial models must reflect the trade-off between getting paid today and investing in future growth.
Dividend Discount Model, Part 3: Capital Structure Projections
You don’t want to “rock the boat” too much with Cash and Debt in this model.
They can grow modestly as the company’s Revenue grows, but they shouldn’t increase to very high levels or fall to very low ones.
In our forecast, Cash rises too much, and Debt / EBITDA goes from 5.0x to 2.5x over 10 years, which is too much de-leveraging:

But it’s difficult to “fix” these issues in a quick model without a more detailed review, so we’ve left them in for now.
The interest rates increase as the existing Debt matures and gets replaced with more expensive Debt, but they fall later as interest rates return to lower levels.
Dividend Discount Model, Part 4: Present Value of Terminal Value and Dividends
Since the Dividend Discount Model is based on Equity Value, not Enterprise Value, the Discount Rate is the Cost of Equity: Risk-Free Rate + Equity Risk Premium * Levered Beta.
The normal WACC formula does not apply since WACC is linked to all investors in the company (Enterprise Value).
DTM’s Levered Beta at this time was only 0.80, but I increased it to 1.00 because all the comparable companies had higher numbers:

For the Terminal Value, you can use either the Multiples Method or the Growth Rate Method, but if you use a multiple, it should be something like P / E that is also based on Equity Value:

Discounting and summing up the Dividends and Terminal Value is straightforward, and you can divide by the share count to get the Implied Share Price.
Note that there is no Equity Value to Enterprise Value bridge here.
Since the DDM is based on Equity Value, it calculates the Implied Equity Value directly, so no bridge is needed.
Overall, DT Midstream seems significantly undervalued based on our analysis.
Even in the sensitivity tables, its Implied Share Price is always well above its ~$49 share price at the time of this analysis:

Dividend Discount Model, Part 5: Is It Useful or Believable?
There are various issues in this model related to the Cash, Debt, and Capacity Growth – but despite all that, the company seems at least somewhat undervalued.
It may not be 50% undervalued, but we’re inclined to believe this result because the Dividend Discount Model tends to produce lower values than the DCF for many companies.
Dividends are always less than Unlevered FCF, and the Cost of Equity is usually greater than WACC, so the PV of Dividends usually adds less to the implied value than the PV of Unlevered Free Cash Flow in a DCF.
But the Terminal Value is not necessarily higher to compensate for this issue – so the overall implied value tends to be lower.
There are some ways to solve this problem, such as by setting a higher Payout Ratio or purposely picking a higher Terminal Value, but these are not always realistic options.
The biggest issues with the Dividend Discount Model, though, are:
- The difficulty in getting the Cash, Debt, and Distribution vs. Growth vs. Retention assumptions
- And the inability to sanity-check everything due to limited disclosures by companies.
For example, I reviewed ~10 other midstream companies before settling on this one.
In all the other cases, the companies’ financial statements were too complicated, the presentations did not disclose information in a useful way, or there were other data issues.
So, it’s best to think of the Dividend Discount Model as essential in some industries (banks/insurance), nice to have in others, and “impractical” otherwise.
It does correspond more closely to the reality of buying stocks (dividends + stock price increases)…
…but that doesn’t mean it’s easier to use in reality.
Free Exclusive Report: 57-page guide with the action plan you need to break into investment banking - how to tell your story, network, craft a winning resume, and dominate your interviews


