
Growth Equity: Full Tutorial and Sample Case Study

Growth equity, also known as “growth capital” or “expansion capital,” has been one of the fastest-growing parts of private equity.
It’s popular for the same reason that value-add real estate is popular: it seems to offer the best of both worlds.
With growth equity, those two worlds are venture capital and private equity (traditional leveraged buyout firms); it sits between them in terms of risk and potential returns.
Growth equity firms also invest in companies that are in between those targeted by VC and PE firms.
These companies are growing quickly, but not as quickly as early-stage startups, and they’re at least approaching profitability or cash flow-positive status.
And as a career, growth equity also offers some of the advantages and disadvantages of both venture capital careers and the private equity career path:
What Do Growth Equity Firms Do?
Growth equity firms, or growth equity divisions of investment firms, invest minority stakes in companies with proven markets and business models that need the capital to fund a specific expansion strategy.
Growth equity is different from venture capital because in VC, the markets and business models are not yet proven, and investors expect most of their early-stage investments to fail.
And it’s different from private equity because in PE, firms acquire entire companies (not minority stakes) but do not necessarily plan to grow them with a specific strategy.
Yes, they want the companies to grow, but the PE firm’s upfront investment goes toward acquiring the whole company, not product development or overseas expansion.
Even if the PE firm aims to grow these portfolio companies with add-on acquisitions, it tries to avoid contributing additional equity if it can do so.
By contrast, in growth equity, the whole point is to use the funds for a specific growth activity whose yield can be reasonably estimated.
For example:
- Paying for employees, buildings, and equipment to enter new geographies or markets.
- Developing new products or services.
- Scaling a company’s sales & marketing by hiring more sales reps and running more paid advertising campaigns.
- Completing bolt-on acquisitions that will boost the company’s revenue and cash flow.
And yes, sometimes growth equity firms offer the company founders early liquidity as part of the investment – within reason (i.e., the opposite of WeWork).
Companies that raise growth capital don’t need it.
They’re making a conscious decision to give up some control and ownership in exchange for higher growth and a larger total pie in the future.
Tech companies are often spurred to raise growth equity by the “land grab” mentality – they need to expand quickly to dominate a particular market before others notice it.
Growth Equity vs. Venture Capital vs. Private Equity
If you look at official descriptions, they say that growth equity firms generally:
- Only acquire minority stakes in companies – very different from traditional leveraged buyouts where the PE firm acquires 100% of the company (or close to it).
- Invest in revenue-generating companies with a proven business model – very different from venture capitalists, who often pour money into pre-revenue companies. The companies do not necessarily need to be profitable or cash flow-positive, but there should be a clear path to profitability (i.e., the opposite of WeWork and Uber).
- Aim for a money-on-money (MoM) multiple (also called a cash-on-cash multiple or multiple of invested capital) of 3-5x rather than the 5-10x that VCs target and the 2-3x for most PE deals. The targeted IRR might be in the 30-40% range.
- Earn returns primarily from growth – organically and via acquisitions, partnerships, regional expansion, and other strategies. Some portion may come from multiple expansion as well, but unlike in PE, there’s little to nothing from debt paydown if you look at a returns attribution analysis.
- Do not use debt… since they are only making minority equity investments in companies. However, they may use preferred stock with liquidation preferences or hybrid securities to reduce their risk.
It’s hard to say what the “average deal size” is; online sources give figures such as $50 – $250 million, $5 – $50 million, $1 – $20 million, and more.
It depends on the size of the company and the size of the firm, but it’s fair to say that growth equity deals are smaller than most LBOs and bigger than most VC funding rounds.
The main risk factor in growth equity is execution – committing to a plan, implementing it, and then getting results from it.
That contrasts with private equity, where there’s also default risk due to the debt, and venture capital, where there’s market/product risk.
Growth equity firms could invest in any industry, but they tend to be skewed toward technology and TMT, with some exposure to consumer/retail, healthcare, and financial services as well.
Growth Equity Careers: The Best of Both Worlds?
An average day in the life of a growth equity analyst or associate is similar to what a private equity analyst or associate experiences: sourcing, market research, deal work, portfolio company work, and modeling.
The main differences are:
- Sourcing: Some firms love to make their junior employees cold call and cold email companies all day. Deals are less complex, so finding a great company first can be a winning strategy.
- Financial Modeling: You’ll build 3-statement models (see here for a full tutorial for a timed 90-minute modeling test), valuations, and add-on acquisition models, but LBO models are less common because of the lack of debt.
- Management Interaction: You probably won’t interact with management teams quite as much because your firm won’t own controlling stakes in its portfolio companies.
- Due Diligence Requirements: For similar reasons – minority stakes rather than control deals – you won’t devote quite as much time and effort to due diligence in deals.
- Interaction with Bankers: You’ll have a bit less correspondence with the sell-side because companies that are good growth equity candidates tend not to be heavily marketed by bankers (though some boutiques do work in this space).
So, what replaces all that time spent on financial modeling, due diligence, and interacting with bankers and management teams?
At some firms, the answer is sourcing.
At other firms, you might spend more time on market research or still devote significant time to portfolio companies, or something else on this list.
The career path is similar to the private equity career path in terms of titles, responsibilities, and promotion times, and the compensation and hours are also similar.
In other words, expect 60-70-hour workweeks and compensation in the $200K – $300K range for Associates, eventually rising to the high-six-figure to low-seven-figure level at the top.
Arguably, the compensation is a bit lower than in private equity, but it’s hard to determine since compensation reports often combine both industries.
The Top Growth Equity Firms
There are some dedicated growth equity firms, but many private equity firms and late-stage venture capital firms also do it.
Family offices, mutual funds such as Fidelity, and hedge funds have even entered the industry, in search of high returns in a low-interest-rate world.
If you asked someone for the most well-known firms, they’d probably cite TA Associates, Summit Partners, JMI Equity, Technology Crossover Ventures (TCV), and General Atlantic.
Other names include Insight Partners, Norwest Venture Partners (NVP), Spectrum Equity, TPG Growth, Guidepost (formerly North Bridge), Warburg Pincus, Battery Ventures, General Catalyst, Volition Capital, Polaris Partners, and Susquehanna Growth Equity.
There are dozens or hundreds of other firms in the space, including some of the best-known VCs (Accel, Benchmark, KPCB, NEA, and Sequoia).
If you want more names, see this list.
Growth Equity Interviews and Recruiting: What to Expect
Unsurprisingly, recruiting and interviews are also very similar to the private equity recruiting process and private equity interviews.
The main differences are:
- More “Off-Cycle” Processes – The bigger firms (e.g., TA Associates) and divisions of PE mega-funds still conduct on-cycle processes, but smaller firms move more slowly and recruit more randomly. You can still go through headhunters, but you can also get results by networking on your own.
- Broader Pool of Candidates – You still have an advantage if you worked at a bulge bracket or elite boutique, but you can potentially get in from middle-market and industry-specific boutiques, especially at the smaller firms. Arguably, it’s also easier to break in from roles like consulting and product management.
- Slightly Less Technical Interviews – You still need to know accounting, 3-statement modeling, and valuation, but they probably won’t go into the same depth on M&A and LBO models as an IB or PE interviewer. Case studies may also be more qualitative.
The question categories in interviews are nearly the same as well:
- Fit/Background – Including your resume walkthrough, why growth equity, why this firm, whether or not you’re OK with the “sourcing model,” and so on.
- Technical Questions – More focus on accounting, valuation, and growth/profitability drivers in models and less emphasis on M&A. “Quick IRR math” questions are still common, but may or may not involve leverage.
- Deal/Client Experience – Again, you need to look at your deals critically and say whether or not you would have invested or done each deal, with a bias toward “growth” as the key criterion.
- Firm Knowledge – You need to know the firm’s current portfolio, its investment thesis, and their previous strategies and exits. They’ll often ask you about their “best and worst” portfolio companies and what you would have done differently.
- Industry/Market Discussions – This category is more important in growth equity interviews than in traditional PE ones, and if you interview at a tech-focused firm, for example, you need to know one specific vertical quite well. Think: major companies, the top one you’d invest in, their competitors, growth drivers, risk factors, and outlook.
- Case Studies – You could get a mental or written paper LBO, a 1-3-hour on-site LBO modeling test, or a take-home LBO model and presentation. But most growth equity case studies tend to be 3-statement models with a focus on the revenue and expense drivers – or open-ended, qualitative cases that focus on market research.
For example, tech growth equity firms often assess your ability to model subscription revenue for a Software-as-a-Service (SaaS) company, which can be tricky due to the differences between bookings, billings, recognized revenue, and deferred revenue.
An open-ended case study might give you a few pages of information on a company, including historical financials, and then ask you to draft a 10-slide presentation with an investment recommendation.
You will have to research the company’s market size, competitors, growth strategies, and strengths, weaknesses, opportunities, and threats to do this.
Valuation and potential returns will be a part of this presentation, but the market analysis will be equally as important.
The Growth Equity Case Study: Atlassian Example
To illustrate, I’ll share a 3-statement modeling case study from one of our financial modeling courses.
NOTE: We have since replaced this Atlassian case study, but you can find a similar example in our Venture Capital & Growth Equity Modeling course.
Additionally, there are many 3-statement modeling and financial statement analysis examples in both our Core Financial Modeling and Advanced Financial Modeling courses, and 3-statement models of all types are common in growth equity.
You can get the video tutorial, case study description, and completed Excel file below:
This one is based on Atlassian, a company that creates software for other software developers, such as tools to collaborate, track bugs, and manage projects.
At the time of this case study, the company earned just under $1 billion in revenue, had slightly negative operating income, and was growing sales at around 40% per year.
It was transitioning from a perpetual-license-and-maintenance model to a Software-as-a-Service (SaaS) model.
In other words, it was moving from one-time product sales to recurring revenue from subscriptions.
Your growth equity firm is considering a $2 billion minority-stake investment in the company so that management can use the proceeds to acquire other high-growth software companies and start rolling those companies’ products into their lineup.
By doing so, the company immediately gains customers and cross-selling opportunities without spending anything on a traditional sales team.
NOTE: This scenario is slightly weird because Atlassian was already public, it was much larger than most “growth equity candidates,” and a $2 billion investment is also far bigger than most deals in this category.
However, the rest of the qualities – growth rates, uses of funds, and evaluation criteria – line up, so we’re going with this example anyway.
I’m not going to cover every single step of this case study, but here are the highlights:
Revenue and Expense Projections
Subscription revenue is driven based on “Billings,” which are different from GAAP Revenue.
Billings represent cash collected from customers, often in advance of using the product or service.
We assume that the Billings from new customers increase by a certain percentage each year – initially 50%, declining to 30% by the end.
We also assume that a certain percentage of customers from the previous year – 90% to 95% here – renew and accept price increases.
Those two numbers together equal the Total Subscription Billings.
Only a percentage of Total Subscription Billings is recognized as revenue in the current year since the company sells contracts for up to 1 year; we’ve assumed the 60-70% range here.
So:
- Total Revenue = Billings in Current Year Recognized as Revenue in Current Year + Billings from Previous Year Now Recognized as Revenue
The Historical setup here is strange because of some financial gymnastics, but the Projections are straightforward (well, kind of – the Excel file is easier to understand than this diagram):

The License and Maintenance segment is similar on the Maintenance side (“Maintenance” for software means paying for support, product updates, and other assistance from the company).
The main difference is that the “New Billings” come directly from the new customers that have purchased one-time licenses in the current year.
Some of the expenses, such as cost of revenue and sales & marketing, are simple percentages of sales, Billings + License Revenue, or other variations.
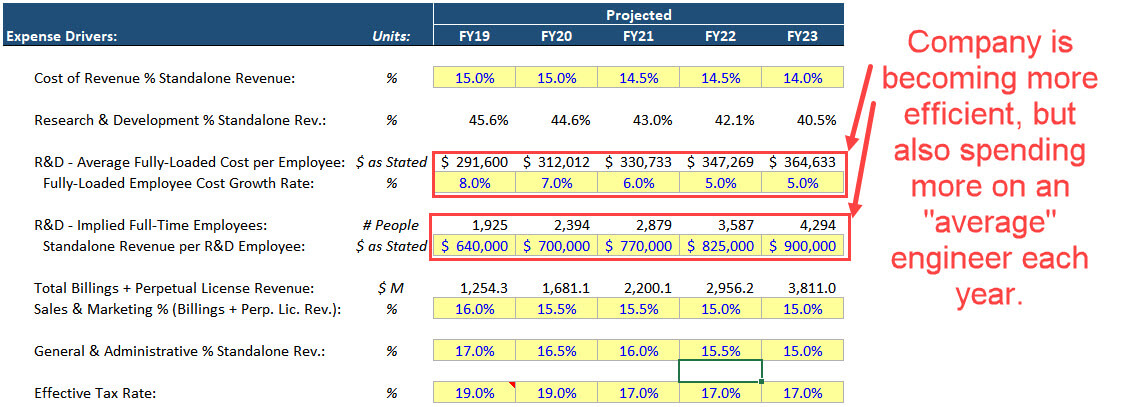
Since Atlassian has extremely high R&D spending, we do something more detailed there.
We assume a “Revenue per Employee” figure, which increases over time to reflect greater efficiencies, and then we assume that the average fully-loaded cost per employee increases.
Yes, numbers in the $200K – $400K range are high, but remember that these are the fully-loaded costs for engineers, so they include salary, benefits, bonuses, equity, and even IT and office space:
We then use these figures and standard assumptions for the Working Capital items to create the financial statement projections.
Add-On Acquisitions
Remember the whole point of investing $2 billion in this company: it’s so they can use the funds to acquire other, high-growth software companies.
We assume they spend $700 million to $775 million per year on these acquisitions, and that they pay an average multiple of 20x revenue (not a typo!).
NOTE: If you’re wondering about the math, yes, the total acquisition spending is just over $3 billion, and that’s because the company funds some of it with its cash balance.
The pay such high multiples because these companies are growing at around 100% per year, with EBIT margins of ~10%; revenue growth declines and margins increase over time.
To set this up, we created a waterfall schedule where we show the revenue and expenses from each year of acquisitions over time and add up the contributions at the bottom:

We also did a mini-purchase price allocation for each acquisition and created Goodwill, Other Intangibles and amortization, and a few other items.
If we were creating cash flow projections without a real 3-statement model, we would skip this step because there’s barely any cash impact from these items.
You can already see the main problem with add-on acquisitions: after spending over $3 billion on acquisitions, Atlassian generates only ~$600 million in extra Revenue and ~$100 million in extra EBIT by the end of Year 5.
The revenue multiples are so high that it’s difficult to make the math work, even with very high growth rates.
Tax Schedule and Net Operating Losses
Atlassian, like many tech companies, has a Net Operating Loss (NOL) balance.
We have a full tutorial on Net Operating Losses, but the usual setup applies here: create NOLs when Taxable Income is negative, and use them up when Taxable Income is positive.
The MIN and MAX formulas in rows 218 and 219 do that:

We ignore NOLs on the Income Statement, record book taxes at the full effective tax rate, and make the book vs. cash tax adjustment on the CFS in the Deferred Tax line item.
The twist here is that the “Taxable Income” is not just the Pre-Tax Income on the Income Statement.
Instead, we have to adjust for items that are not cash-tax-deductible, such as the Amortization of Intangibles and a portion of the Stock-Based Compensation.
These items result in a decent difference to the company’s book taxes, though you could skip them under time pressure.
Returns Calculations
Finally, we calculate the returns at the end based on an assumed revenue multiple, the company’s revenue in the exit year, and the company’s Net Debt at that point (positive since Cash exceeds Debt):

Yes, those revenue multiples are high, but at the time of this case study, Atlassian was trading at a 20-21x revenue multiple and had traded at between 10x and 25x historically.
We create some sensitivity tables at the bottom to analyze the IRR under different assumptions for the exit multiple and revenue growth rates.
NOTE: Normally, we would use EV / EBITDA multiples instead of revenue multiples, but Atlassian’s historical EBITDA was very low and borderline negative, so it didn’t make sense in this case.
So… Should We Do This Deal?
Our firm is targeting IRRs of 20-25% in the base case, over 30% in optimistic scenarios, and a minimum IRR of 10% in downside cases.
So, this one seems like an easy answer on the surface: yes, because we achieve 20-40% IRRs across all these sensitivities, and the minimum IRR seems to be above 10%.
The company is growing quickly and transitioning to a better business model, and even if the exit multiple falls to the 7-10x range, we still come close to the 10% minimum IRR.
We could mitigate the risk of multiple contraction by using a convertible bond or convertible preferred stock instead.
That’s how we answer this question in the real case study in the course.
BUT you could easily argue against the deal as well.
Why?
Yes, the numbers look good, but that is mostly due to the company’s organic growth.
Add-on acquisitions barely do anything, and if you remove them altogether, the IRR only decreases by 2-3%.
So, another firm looking at this might say, “The company is good, but the way they’re planning to spend this $2 billion doesn’t make sense.”
These add-on acquisitions are too expensive, and their impact on the returns is questionable.
If the company had a better plan for these funds, such as hiring dedicated sales reps or scaling its sales & marketing strategy, then the deal might make more sense.
Whither Growth Equity?
This is just a short example of how you might tackle a growth equity case study.
In an open-ended case study, and in real life, you’d spend more time on market research and try to figure out the plausibility of these add-on acquisitions or other potential uses of the $2 billion.
But in a time-pressured or on-site test, something like this is realistic.
If that’s your cup of tea, then growth equity might be as well.


About the Author
Brian DeChesare is the Founder of Mergers & Inquisitions and Breaking Into Wall Street. In his spare time, he enjoys lifting weights, running, traveling, obsessively watching TV shows, and defeating Sauron.
Free Exclusive Report: 57-page guide with the action plan you need to break into investment banking - how to tell your story, network, craft a winning resume, and dominate your interviews
Comments
Read below or Add a comment
Hi Brian,
Thanks for this! Had one question regarding change in NWC. Seems odd that all that deferred revenue in the projected period isn’t offset by a change in the operating assets. Because otherwise, the deferred revenue has a huge effect in the positive direction regarding cash flow in the outer years. Shouldn’t deferred revenue be offset?
Thanks,
Alex
The high Deferred Revenue comes from the company collecting cash in advance for services yet to be delivered. So the offset on the Assets side is Cash, which is a non-operating asset… so the Change in WC should be up by a huge amount because of the Deferred Revenue increases, as Cash is not an operating asset and the Change in Cash is not a part of the Change in WC.
Hi – what is the logic / intuition behind % of subscriptions being deferred decreasing through the projection period i.e. going from 66% recognized that year up to 70% by the end of the projection period.
Thanks
The company has 1-year and shorter contracts and was increasingly moving toward these shorter-term contracts, so less revenue was deferred.
Hey Brian,
Thanks for the article
I’m based in London
Was wondering if there’s merit in working in Big 4 TS, would that give me an edge to be able to make the move to a top growth equity firms (having deep understanding of revenue drivers etc) or would I have to move into Banking first in order to have a competitive chance
Also, is there any advantage of being CA qualified within this space – I sometimes see a cohort from PE funds who want to hire people who are CA qualified, but not sure if this is relevant to growth equity
Thanks in advance
I think it would be tough to move directly from Big 4 TS to a top growth equity firm because you need experience working on deals from start to finish. It is slightly easier to do this in Europe, but your chances would still be higher with IB experience first.
I don’t think being CA-qualified would help much. It might give you a small boost, but growth equity is mostly about deal sourcing and execution, and accounting skills are less critical than they are in, say, audit roles.
in your Financial Modeling Mastery, does it cover various caveats, eg. roll-over debt, divident recap, call premiums, add-on acquisition, PIPEs etc. If I hope to use it to preparing for growth equity interview, do I need to cover all above? thanks
The course is holistic, so it’s based on a series of case studies rather than a specific set of features or check boxes. We cover the differences between assuming and repaying debt, add-on acquisitions, call premiums and other features of debt, etc., but not technically a dividend recap in an LBO (yet).
It can be helpful for growth equity interviews, but it’s geared toward financial modeling, not qualitative analysis. And for growth equity, you will be spending a lot of time in case studies and on the job analyzing markets and making recommendations based on that rather than strict model output.
Hi, I wonder where can I find Subscription Revenue Deferred numbers for FY15-18?
You can’t, these are our own estimates.
Thanks for the article. Would a background in Project Finance in an up-and-coming industry lend relevant experience for working in growth equity? Do you know how firms/HHs in the space view PF?
No, not really. PF is quite different because it’s basically credit analysis and requires you to evaluate the downside risk, while growth equity is all about “the story.” I don’t think a PF background would give you much of an advantage.
Hi Brian, thanks for the great article as usual. I have a couple of questions:
1. What are your thoughts on joining a top growth equity firm vs going into bulge bracket/EB banking right out of undergrad? Does going into growth equity lower your exit opps?
2. What do growth equity interviews look like? Are there case studies, presentations, etc.?
Thank you in advance for the insight.
1) Yes, somewhat, because growth equity is not as well-known outside the finance industry. Normal people don’t know the names of the top firms here. So it’s still not recommended vs. going into IB.
2) Similar to IB/PE/VC interviews. There is a literal growth equity case study example in this article (???).
Hi is there somewhere to download the template – i.e. the non-completed case study for practice? Thanks!
There is a blank version available in our courses, but not in the free samples on this site.
Hi Brian, looking at the 2-3 week learning timeline for private equity interviews in your Excel and Fundamentals course, for growth equity interviews, would I need to cover any of the LBO stuff (Modules 12 and 13)? I am guessing I need to cover everything else listed as well.
For growth equity, I think you can skip Module 13, but not Module 12, because LBO-related questions could still come up in growth equity interviews. Yes, technically, growth equity deals do not use debt, but some firms do a mix of different deal types, and growth equity deals and LBO deals have similar returns drivers and model setup.
So, I would recommend looking at the “Simple LBO Model” / “Paper LBO Model” examples at least, and reviewing the first few parts of the full model and the returns calculations at the end in Module 12.